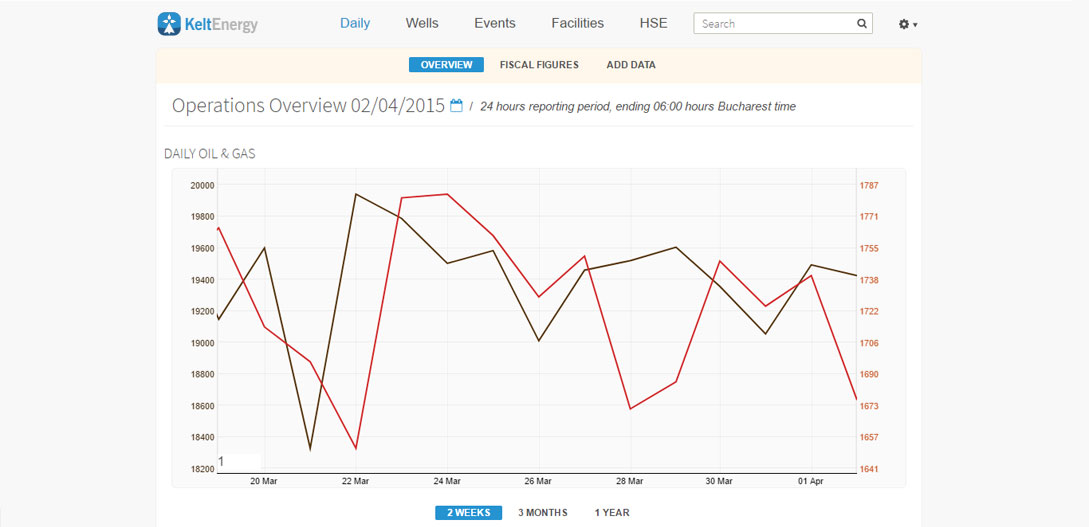
Application allows to graph daily production figures. Such output curves are the main performance indicator in Oil & Gas production operations.
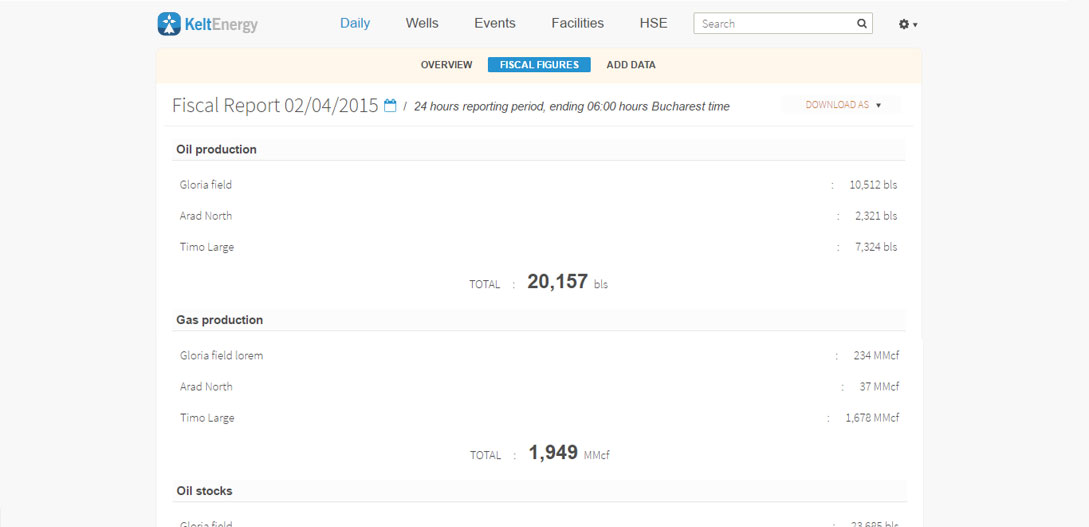
OilOps allows to configure fiscal reports for local authorities. Reports are securely shared over the web.
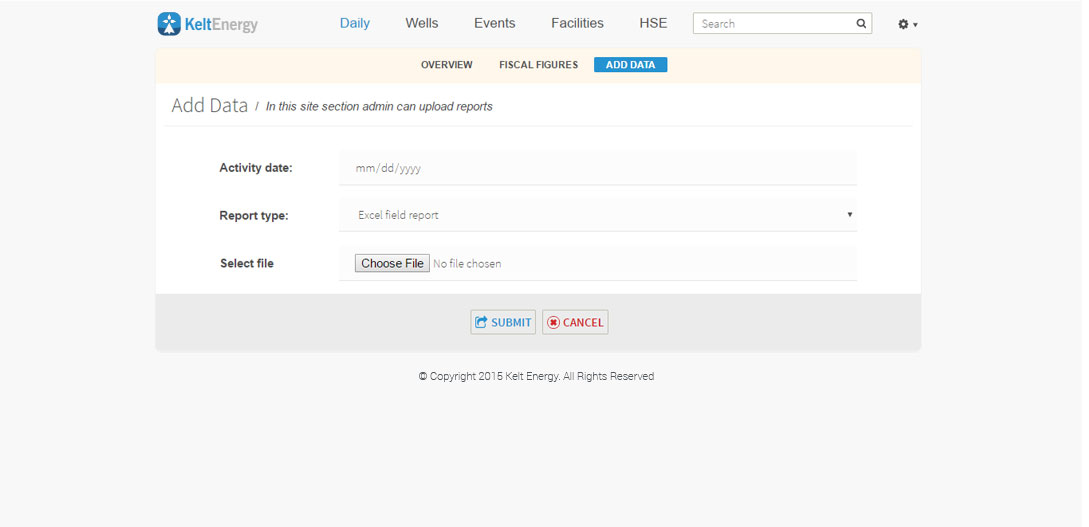
Daily report datas may be inputted manually using web forms. Spreadsheet field reports may also be directly uploaded to the system to avoid tedious reentries.
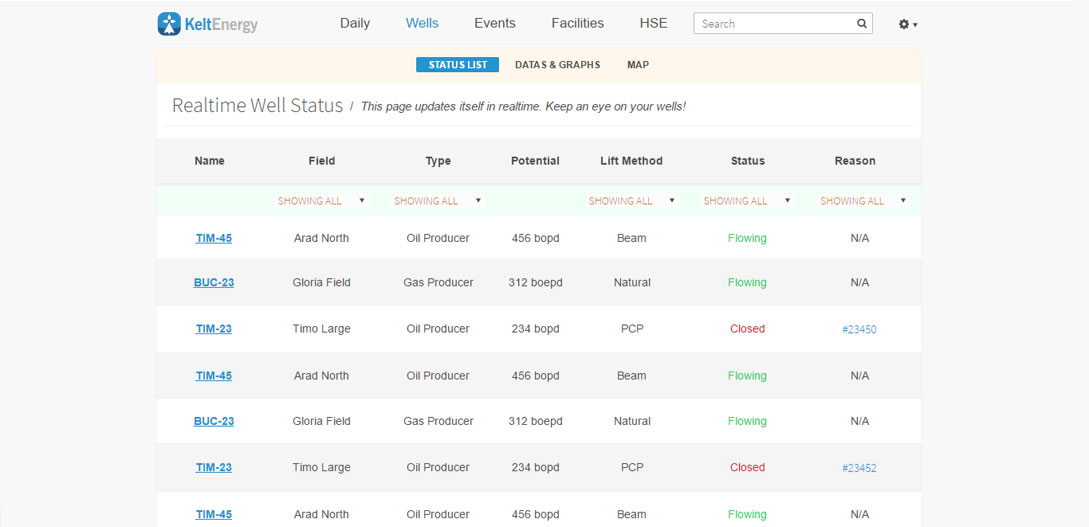
Application allows to visualize realtime status for wells and facilities.
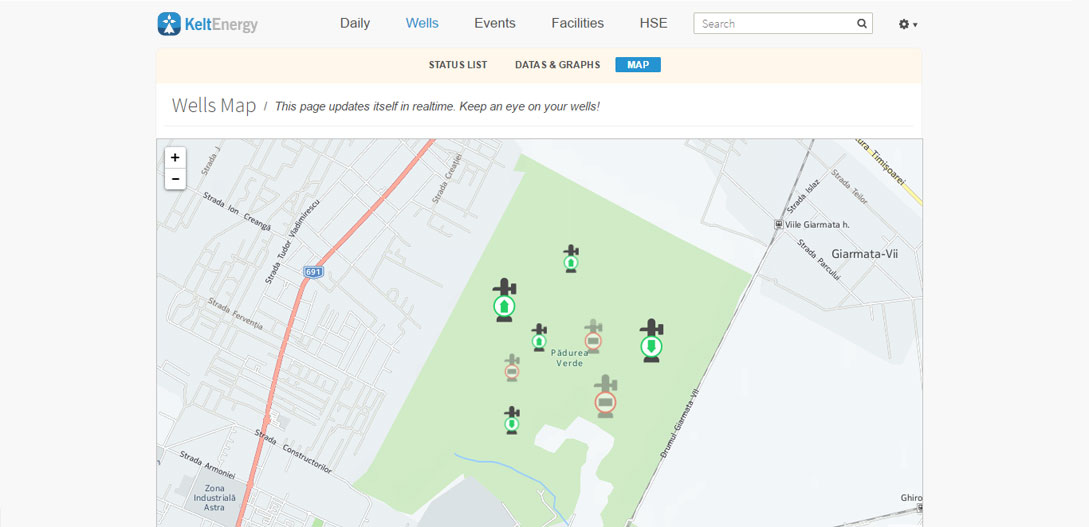
OilOps integrates a complete geographical information system. Any facility or Event may be visualized on a map.
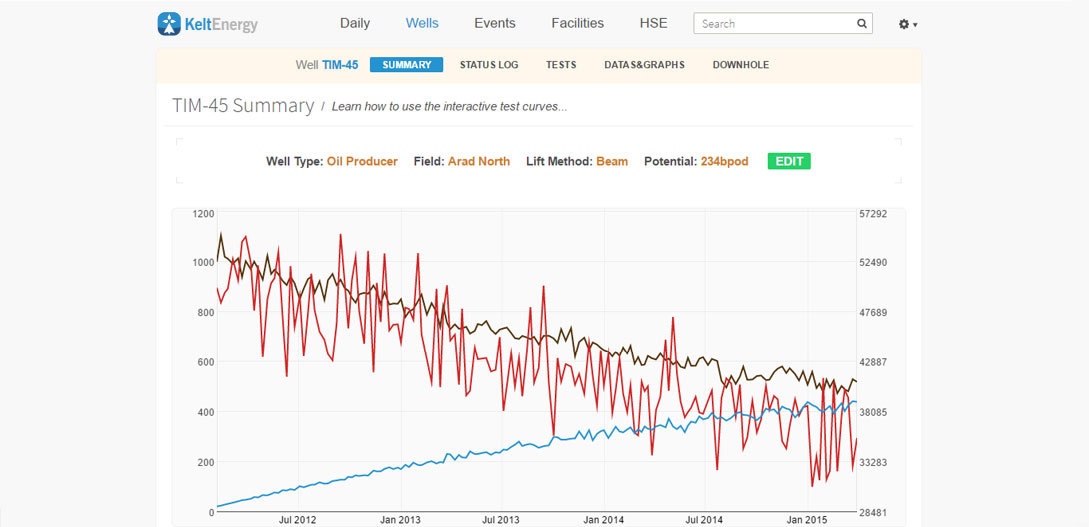
Well output informations can be graphed very easily.
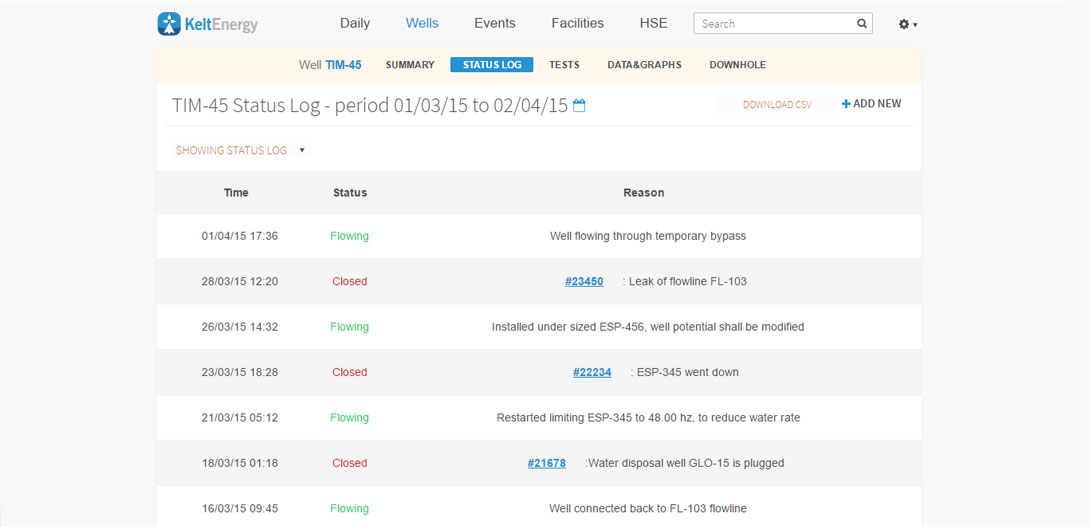
A status log is maintained for each facility under supervision. Root cause of status changes can be determined very easily...
Performance monitoring of wells is one of the main goal of OilOps. OilOps datas can serve as a basis for reservoir engineering back allocation.
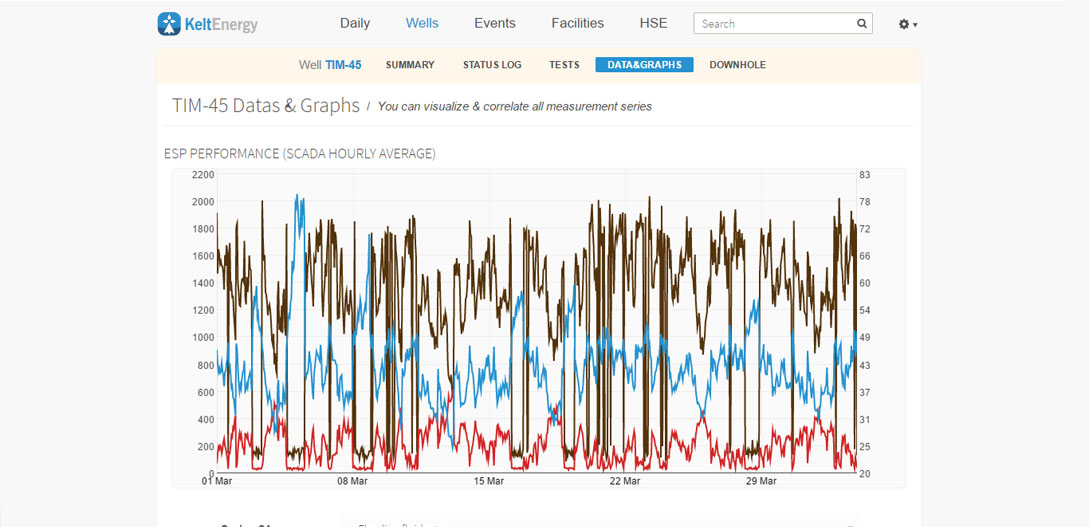
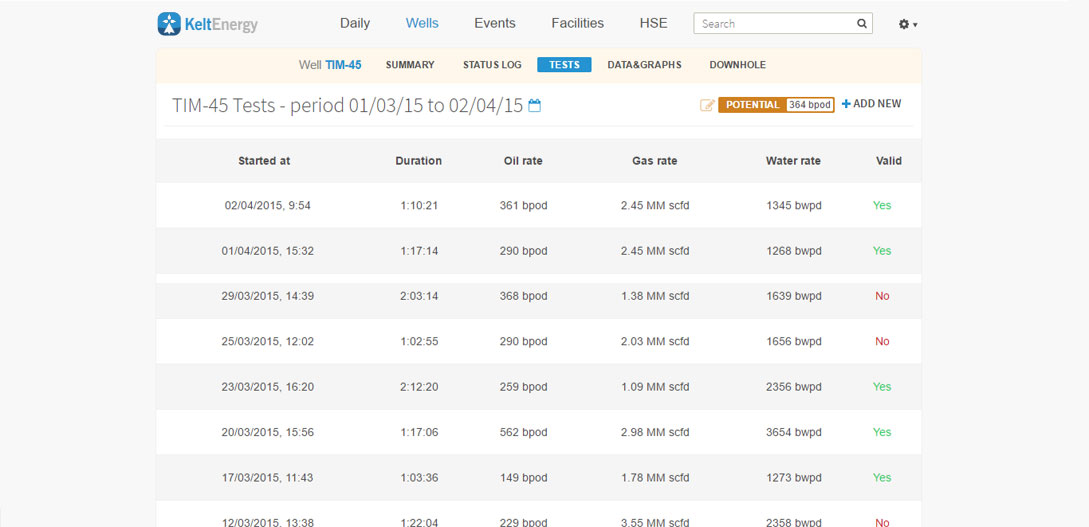
OilOps allows archiving and visualizing any field measurement series.
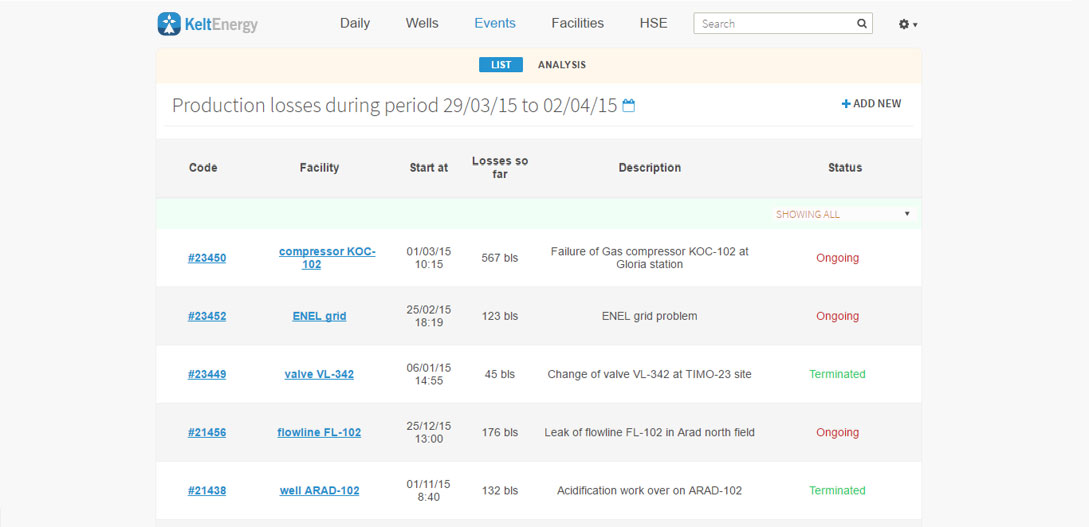
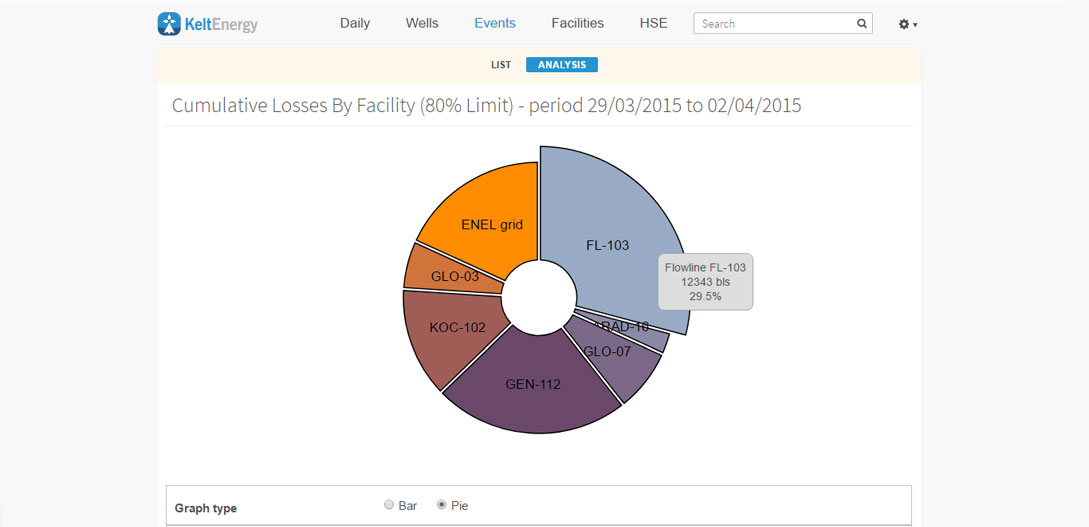
OilOps allows accurate tracking of any field event. This is used to deliver accurate losses report.
Operation Key Performance Indicators can be graphed in realtime.
OilOps is a web application that is used in the context of petroleum extraction operations. It allows daily field reporting and efficient visualization of wells and facilities performance data. Safety and Environmental monitoring is also integrated.